Today we worked further on bringing the project together, drawing together all our current work and making improvements where necessary.
MLabs/Visualization connection
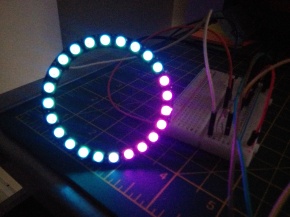
I worked on building a connection to the mLab database, pulling data and using them for parameters for a circle. The code checks the database for a new entry every 15 seconds.

Reading values from Database
For example, I set up mapping for sliders to RGB: The slider takes a value of 0 to 8 for the user, which is mapped to a number between 0 and 255 for 3 of the values (in this case the vars kind, trust and help). I also applied this to the radius and speed of movement.
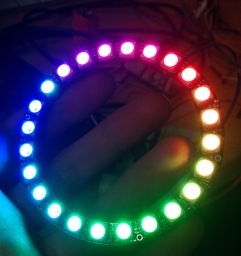
Next, Gintaré and Chris will take this to build into their visualisation in its current state.
User Interface Modifications
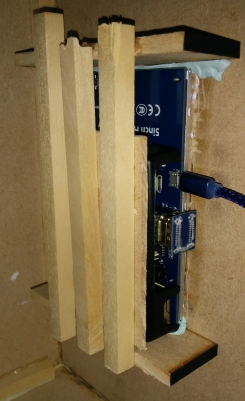
We then looked at Gintaré’s slider inputs and how they would look in the physical build.
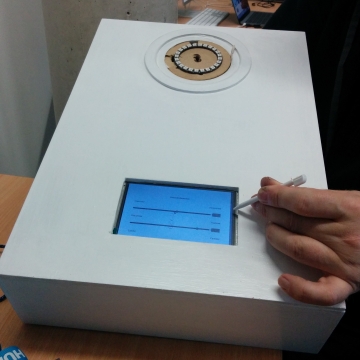
First slider test in plinth (without the glass head or diffuser)
After reviewing both its looks and ease of interaction, we decided to make a few changes, such as making the text/scrollbar larger and removing the numbers from the sliders (As they do not display properly on Raspberry Pi).
Gintaré made modifications based on these observations and we quickly reviewed it. We also decided to colour code each section of sliders to each section of the CANOE model. This not only breaks it up but makes it more visually appealing in a way that makes sense.

Touchscreen with enlarged scroll bar for ease of use.
We decided it would still be best to display the touchscreen with the stylus for ease of use as the sliders can still be difficult to use at this size.

Touch screen with colour coded sections (per canoe model)
Since the touchscreen has no enabled right-click function, once the app is full-screen it is very difficult to get out of – meaning the viewers won’t be able to (intentionally or accidentally!) exit it.
We decided to bevel the edges that surround the screen as they make it difficult for users to easily reach the screen. This will also make it look more inviting to a user by bringing it into their view.
Connecting MongoDB/mLab to front-end
I started working on code to input values to the database using Gintaré’s previously made slider interface. This was built using express, npm and node.js. On recommendation from Chris B, Express was used in place of PHP.
When run, the code hosts the necessary files (such as Gintaré’s sliders) on a local server, which sends the data to the remote server when “Generate” is pressed.
Since Node.js means the code is ‘modular’, we decided to put the login details in a separate .js file (rather than censor the mongoDB login details when on GitHub)

Installing Node.js & npm to Raspberry Pi
Once this was up and running (and confirmed to work on mLab), I moved the files and installed the necessary npm packages on my Raspberry Pi. I then tested the connection to mLab to ensure the data was working.

Running the local server (Hosting the sliders form) on Raspberry Pi
We then put this server connection together with Gintaré’s updated user interface.
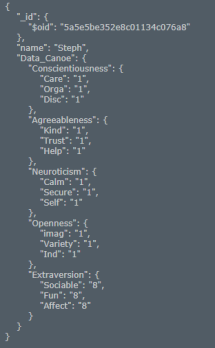
Data inserted into mLab via Raspberry Pi

Multiple documents in MongoDB database.
Now that we have data both coming into and out of the database, we are ready to move onto the next steps!
Next Steps
- Finish Visualization
- Put together final physical prototype (Seat raspi, sort out power supplies .etc)
- Preview in IVT – test visualisations before presentation
- (If time allows) Make a system for colour of head based on last data entry.